
Using the 80/20 Pareto based examination described earlier in this paper, it might be instructive to see what kind of Bandwidth expense saving might be achievable.
These numbers are predicated on a burdened aggregate $2780 / Gbps / month cost model. Again, cost of transit for each CSP could vary appreciably. Curiously, some estimates place unburdened bandwidth costs more than an order of magnitude higher than this. (Prince, 2014) (Rao, 2016).
The largest CSPs get better deals. They’ve also have been moving their network capacity closer to the edge. Roughly a third of all SVoD capacity currently bypasses the internet’s core; 27% in 2017, growing to 33% in 2022 (Cisco, 2019). While this reduces Bandwidth costs, it raises other costs and complexity.
As this market matures further, it is expected that a greater share of SVoD assets will be sourced from within each subscriber’s ISP. Each CSP “lending” the required hardware to each ISP. Each ISP would house the CSP’s co-located gear. This co-opts the ISPs to become a part of the CSP’s private CDN. This does not alter the amount of traffic delivered to the subscribers. This is the Netflix model. It’s not yet clear if other CSPs will replicate this methodology
The graph below follows the 30% CAGR until 2022 per the Cisco forecast. I reduced the CAGR estimation in the remaining years to limit expectations. Exponential growth doesn’t go on forever.
I’ve assumed no adoption for 2 years, and a very modest rate for the next 2. As recognition grows and the equipment replacement cycle advances, I imagine a 4% adoption in 5 years. The annual savings at that point could reach $11B, and more than a cumulative $300B over a decade.
With these savings, the beneficiaries of this bandwidth expense markdown could easily afford to subsidize the STB replacement cycle, in order to accelerate the adoption curve. In 2025 there will be roughly 1B Internet connected TVs in the US, some might only need a flash drive and a software update.
Don’t feel bad for any potential revenue lost by the ISPs and independent CDNs due to this efficiency gain. Their pricing power will remain significant as they continue to be a critical network conduit to the subscriber. These providers will still contend with an exponential demand curve due to IoT, Cloud Gaming, VR & AR, all of which expect to have CAGR in the 50-60% range.
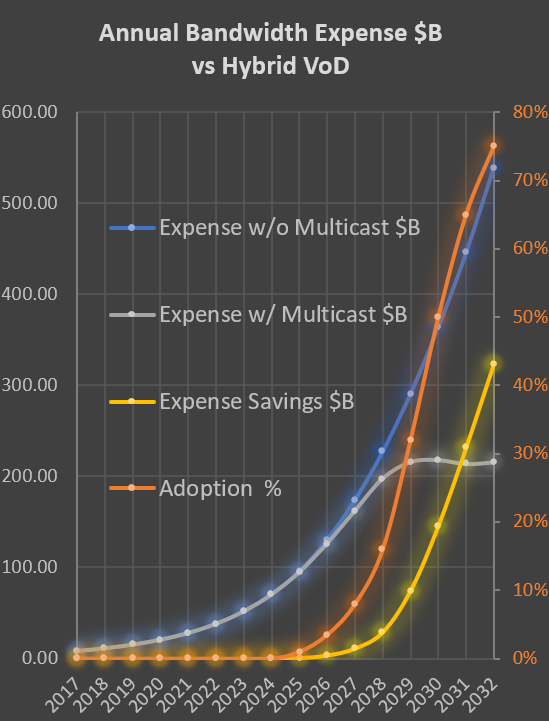
The above graph illustrates Annual Worldwide Bandwidth Expense, projected forward through 2029.
The orange curve is the prospective adoption percentage of Hybrid SVoD. It is viewed against the right vertical axis. The remaining blue, grey and yellow curves are scaled in Billions of Dollars and are viewed against the left vertical axis.
